

A clear-eyed look at what the Sellvia advertising system actually does, when it helps, and the numbers every new seller must understand before spending a dollar.
Quick Answer: The Tool Can Help, But It Does Not Remove the Math
Here is the honest version, upfront.
The Sellvia built-in ads tool is a genuine shortcut for beginners. It removes a real barrier – the complexity of setting up Google Ads, Facebook campaigns, or TikTok creatives from scratch – and replaces it with a single dial and a budget. For someone who has never run a paid campaign in their life, that matters more than most marketing professionals are willing to admit.
But the shortcut does not eliminate the business fundamentals underneath. Whether traffic comes from a self-managed Google Ads account or from Sellvia’s built-in system, the same math governs profitability: if the cost to acquire one order is higher than the margin left after fees, the store is generating sales and losing money at the same time.
That is not a trap in the conventional sense – nobody is hiding that math from sellers. But it is a place where many beginners get confused, because sales volume and profitability feel like the same thing when they are not. This article explains the distinction in plain terms, shows you the numbers that actually matter, and gives you a framework for deciding when the Sellvia ads tool is working for your store and when it is working against it.
What the Sellvia Built-In Ads Tool Is Supposed to Do
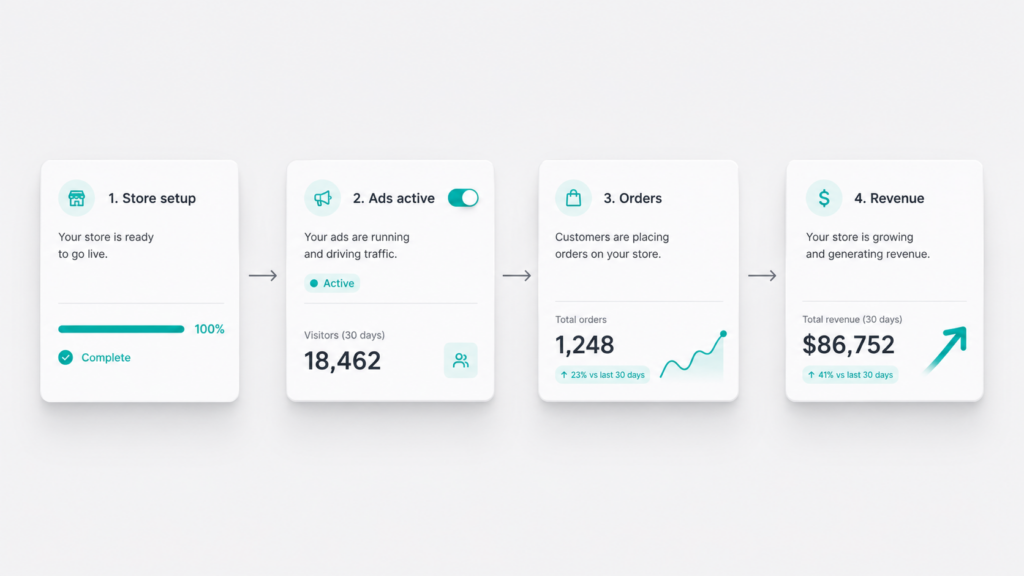
Sellvia is a complete online business platform built for people who are starting from zero – no ecommerce experience, no technical background, and often a limited budget. The platform gives new sellers a fully operational store, pre-loaded with digital products ready to sell, and a management dashboard that handles the operational side of the business.
The built-in advertising system is one of the platform’s most distinctive features. Instead of asking sellers to navigate the complex and often expensive world of digital advertising independently, Sellvia purchases traffic at scale from major channels – Google, Facebook, and TikTok – and redistributes that traffic directly to seller stores.
The model functions similarly to how advertising works on Amazon or Etsy. Sellers allocate a daily budget, the platform’s system handles targeting, creative delivery, and optimization, and traffic flows to the store. The seller does not need to write ad copy, design creatives, configure audiences, or manage bids. They set a number and let the system run.
The daily budget range is $10 to $50, and new sellers receive a $40 advertising coupon as part of their free trial – which means many sellers run their first several days of advertising at no out-of-pocket cost.
The intended result: new sellers see real visitors arriving at their store quickly, sometimes within hours of activating the ad system. For a first-time entrepreneur who has never watched traffic analytics in real time, this is a legitimately exciting moment. It makes the business feel real in a way that a static storefront cannot.
Why Beginners Are Drawn to Tools That Simplify Ad Setup
Understanding why the Sellvia ads tool resonates so strongly with its target audience requires understanding what that audience is actually dealing with when they arrive.
Most new Sellvia sellers are not marketers. They are people who want to start earning money online and have found their way to Sellvia because it promises to remove most of the technical barriers that stop beginners before they start. They are not comparing ad platforms. They are not thinking about CPM versus CPC models. They are asking a simpler question: can I actually make this work?
For this group, the conventional route to online advertising is genuinely intimidating. Setting up a Google Ads account involves keyword research, campaign structure decisions, bid strategy selection, conversion tracking setup, and quality score optimization – none of which is intuitive without experience. Facebook’s ad manager has improved over the years, but creating compliant, effective creatives, building audiences, and interpreting performance data still requires a meaningful learning curve. TikTok ads add yet another layer of creative and algorithmic complexity.
Any one of these platforms can absorb weeks of learning time and hundreds of dollars in test spending before a beginner understands what is working. Most beginners never get that far. They bounce off the complexity and abandon the idea of online advertising entirely.
Sellvia’s built-in system sidesteps this entirely. There is nothing to configure. There is no campaign architecture to build. There are no audiences to define. The seller picks a number, activates the system, and traffic arrives. For someone who came in with no advertising background, this is not a small convenience – it is the difference between attempting advertising and never attempting it.
This is the genuine value the tool delivers for beginners, and it should not be dismissed.

The Real Question: What Does Each Order Actually Cost?
Now comes the part that many beginners skip, and skipping it is where problems begin.
The question is not “am I getting orders?” The question is “what does each order cost me, and does my margin cover that cost?”
These sound like the same question. They are not.
An order is a sale. A profitable order is a sale where the revenue you keep after all costs exceeds the money you spent to generate that sale. If you spent $30 in advertising to produce one order that generated $15 in margin after fees, you got an order and lost $15 doing it.
For Sellvia sellers, the cost per order from the built-in ads system depends on several variables: how much the seller is spending per day, how many orders that daily spend generates, and which products are being purchased. The cost-per-order calculation is straightforward:
Cost per order = Daily ad spend ÷ Number of orders per day
If a seller spends $20 per day and receives four orders, the cost per order is $5. If the same $20 generates one order, the cost per order is $20.
This number – cost per order – must be compared directly to the margin each order generates. On Sellvia, sellers earn a 50–70% markup on digital product sales. If a product sells for $30 and the seller’s markup is $18, then:
- If cost per order is under $18, the store is profitable per order.
- If cost per order exceeds $18, the store is losing money on every sale.
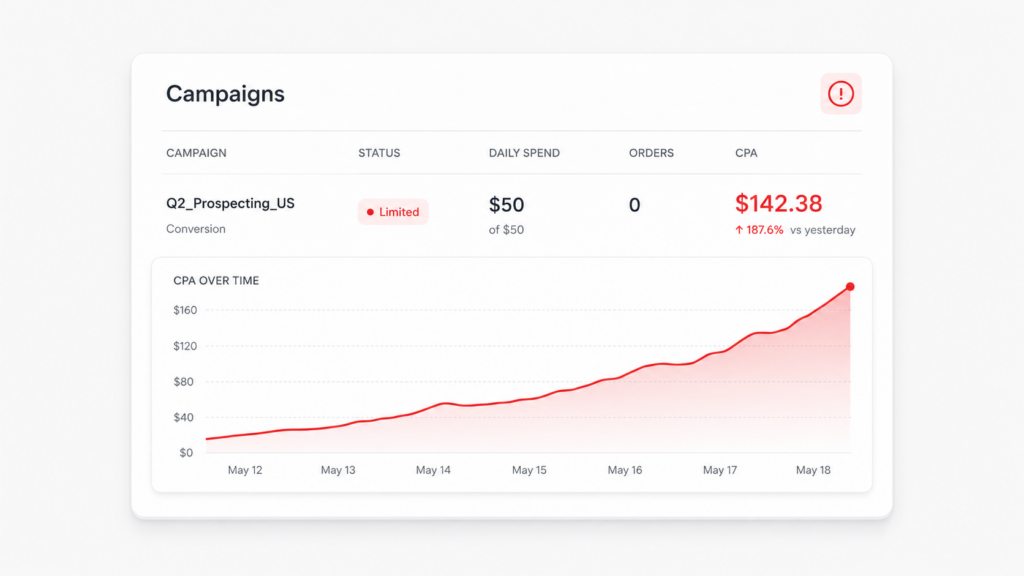
The platform’s advertising system can generate sales efficiently in well-matched niches and product configurations. But it can also generate sales at a cost that exceeds margin, particularly during the early optimization period when the system is learning which audiences convert best for a particular store.
The beginner’s natural instinct is to see sales and feel successful. The more disciplined question is: what did each of those sales cost me?
Getting orders is not the same as making money. A store can process five orders in a day and still be operating at a net loss if the cost per order exceeds the margin per order. Track both numbers from day one – not just order count.
Why ROAS Screenshots Can Be Misleading
Return on Ad Spend (ROAS) is the most commonly cited metric in digital advertising success stories. “4x ROAS” sounds unambiguous: for every dollar spent, four dollars came back. Screens showing strong ROAS numbers circulate constantly in ecommerce communities and success testimonials.
The problem is that ROAS measures revenue generated per dollar spent – not profit generated per dollar spent. These are different numbers.
Consider a seller who spends $100 on advertising and generates $400 in revenue. That is 4x ROAS. It looks excellent. But if those $400 in sales involved $320 in costs – order processing fees, platform subscription, product cost – the $100 in advertising spend generated $80 in gross profit, and that $80 must still cover the $100 in ad spend. The final result is a net loss despite a “good” ROAS.
For Sellvia sellers specifically, the revenue number in a ROAS calculation is the full sale price. The relevant number is the margin after order processing fees – which is the actual money the seller keeps. A seller earning $15 in net margin on a $30 product has a very different business than ROAS calculations based on $30 suggest.
This is not a Sellvia-specific issue. It is an industry-wide confusion that affects ecommerce sellers across every platform. But beginners who are first encountering advertising metrics are particularly vulnerable to focusing on the number that looks impressive rather than the number that matters.
When evaluating the Sellvia ads tool – or any advertising system – the metric to trust is cost per order relative to net margin per order, not ROAS.
A 4x ROAS can still mean a losing store. ROAS is calculated on revenue, not on the margin you actually keep. Always run your ROAS number against net margin – not gross sale price – before deciding the ads are working.
CPA, AOV, Margin, and Break-Even: The Numbers That Matter
Let’s define the four numbers every Sellvia seller running paid advertising should know cold.
CPA – Cost Per Acquisition This is what you pay, in advertising spend, to generate one sale. It is the most important number in your advertising performance. Calculated as: total ad spend ÷ total orders generated.
AOV – Average Order Value The average revenue per order. If you sell products at different price points, some customers will buy higher-priced items and some lower. AOV tells you the average across all orders. Higher AOV generally means more room for advertising costs.
Margin per order This is your actual keep after all deductions on a single order: AOV minus order processing fees, minus any other direct costs. This is what you actually earn per sale.
Break-even CPA The maximum you can afford to spend acquiring one order and still break even. Calculated as: margin per order ÷ (1 + desired profit margin). At the most basic level, if your margin per order is $20, your break-even CPA is $20. If your CPA is below $20, you are profitable. If it is above $20, you are losing money.
Mapping these four numbers to the Sellvia context:
| Metric | Scenario A – Profitable | Scenario B – Losing Money |
|---|---|---|
| Daily ad spend | $20 | $20 |
| Orders per day | 3 | 0.8 |
| CPA | $6.67 | $25.00 |
| AOV | $35 | $35 |
| Margin per order | $22 | $22 |
| Break-even CPA | $22 | $22 |
| Profit / Loss per order | +$15.33 | -$3.00 |
| Daily result | +$46 profit | -$2.40 loss |
The Sellvia ads system did not change between these two scenarios. The product-audience match did.
When the Sellvia Ads Tool Can Be Genuinely Useful
The built-in advertising system delivers real value in specific contexts. Understanding these helps sellers activate the tool at the right moment rather than writing it off early or over-investing before conditions are right.
For sellers testing product-market fit quickly. The tool’s biggest advantage is speed of feedback. A seller who activates the system on day one can have traffic and order data within 24 hours. On any self-managed platform, the equivalent testing cycle takes significantly longer to set up and interpret. The Sellvia system compresses the discovery phase.
For sellers with no advertising background. The system does something meaningful: it removes decision paralysis. Many beginners never run any advertising because the learning curve is too steep. Running zero ads generates zero data and zero revenue. A system that produces real-world performance data – even imperfect data – is more useful than perfect theoretical knowledge that never gets implemented.
During the free trial with the $40 ad coupon. This is the optimal window for testing the system. The seller has no out-of-pocket ad cost during this period, which means any orders generated are pure upside and the CPA calculation changes fundamentally. The trial period is designed to generate that first sale experience, and the coupon is the mechanism that makes the economics work for the seller during testing.
The $40 coupon is not just a welcome gift – it is a testing window. Use it to measure real CPA for your specific store and product mix before you spend a dollar of your own money on advertising.
For stores with strong product-niche alignment. When the store’s product catalog is well-matched to Sellvia’s traffic channels and the mall environment, the system can find buyers efficiently. Sellers who have invested in expanding their product catalog and refining their store’s niche positioning tend to see better advertising performance than those running a generic, undifferentiated store.
As one channel among several. The tool performs best when it is not the only traffic source. Sellers who have also activated organic traffic through SEO tools or social media channels are more resilient to periods of weaker paid ad performance, because their total order volume is not entirely dependent on a single channel.
When the Sellvia Ads Tool Becomes Expensive
The same system that delivers value in the scenarios above can become a source of loss in different conditions. These are the warning signs.
When the daily budget is too high relative to order volume. Newer stores with limited product selection and no traffic history may see low conversion rates while the system optimizes. Running $50/day before the system has found its footing means accumulating high CPA numbers during the learning phase. Starting at the minimum and increasing gradually as performance data accumulates is the more conservative approach.
When the seller does not monitor CPA. The most common mistake is treating the ad system as a “set and forget” mechanism without checking whether the cost of acquiring each order is within a profitable range. The system runs regardless of whether it is generating profitable sales or unprofitable ones. Monitoring is the seller’s responsibility.
When the store has low margin products without sufficient volume. A product with a $10 margin can generate healthy profits if the CPA is $3. The same product at a $12 CPA produces consistent losses. Low-margin products require either very efficient traffic or high order volume to work – conditions that are harder for new stores to achieve.
After the free coupon is consumed without sufficient order data. The transition from coupon-funded advertising to real-money advertising changes the economics significantly. Sellers who did not use the trial period to generate meaningful performance data – understanding which products convert, what typical CPA looks like for their store, what their AOV is – are making investment decisions without the information needed to make them well.
When subscription costs are factored into break-even but not the mental model. The $39/month platform subscription is a fixed cost that exists regardless of order volume. For a seller generating 5 orders per month, that subscription represents a per-order cost of $7.80. For a seller generating 50 orders per month, it is $0.78. Fixed costs matter more when volume is low, and they should factor into the honest break-even calculation.
Fixed costs shrink as volume grows – but they do not disappear. At low order volumes, the monthly subscription has a meaningful impact on per-order economics. Include it in your break-even math, especially during the first 30-60 days.
What Beginners Should Track Before Increasing Budget
Before a Sellvia seller increases their advertising budget, there is a minimum set of data points they should have established. These are not complicated metrics – they are the basic business numbers that determine whether scaling up will produce more profit or more loss.
| Metric | How to calculate | Green light to scale | Red flag |
|---|---|---|---|
| CPA | Total ad spend / total orders | Below your margin per order | Above your margin per order |
| AOV | Total revenue / total orders | Growing or stable | Declining over time |
| Margin per order | AOV minus all processing fees | Covers CPA with room to spare | Barely covers CPA |
| Break-even CPA | Margin per order | CPA is 20-30% below this | CPA is at or above this |
| Data period | Minimum 7 days continuous | Consistent pattern visible | Only 1-2 days of data |
| Conversion trend | CPA direction over time | CPA improving week on week | CPA flat or rising |
At least 7 days of ad data at current budget level. Ad systems including Sellvia’s need time to optimize delivery. Performance in the first 1-2 days often does not reflect steady-state performance. A week of data gives a more reliable picture.
Total orders generated and total ad spend for that period. This produces your empirical CPA – not estimated, actual. This is the number to take seriously.
Average order value across all orders. Pull the actual revenue numbers, not what you hope the average will be.
Net margin per order after processing fees. Calculate this honestly. What did you actually keep per order after all deductions?
Break-even CPA. Compare your empirical CPA to your break-even CPA. If empirical CPA is below break-even CPA, increasing budget in the same conditions should increase profit proportionally. If empirical CPA is above break-even CPA, increasing budget will accelerate losses.
Conversion rate trend. Is CPA improving over time as the system learns, or is it static? An improving CPA trend suggests the system is optimizing effectively. A flat or worsening trend at current budget should be understood before scaling.
Do not scale a budget that is not yet profitable at its current level. More spend on an unprofitable setup produces larger losses faster. Confirm break-even at current budget first, then increase.
Beyond the numbers, there are structural factors that improve advertising performance regardless of which system drives the traffic:
- A professional domain name builds trust and improves conversion rate. A store operating on a generic default domain converts worse than the same store with a clean, memorable domain.
- More products in the catalog give the advertising system more surface area to match buyers with relevant items, which generally improves conversion efficiency.
- A unique store design differentiates the store from others in the same mall environment and builds buyer confidence.
These are the structural investments that make advertising more effective – and they are decisions within the seller’s control.
Final Verdict
The Sellvia built-in ads tool is a legitimate solution to a real problem: it makes advertising accessible to people who would not otherwise attempt it, compresses the time from store launch to first sale data, and removes the steep learning curve of managing paid campaigns across multiple platforms independently.
For sellers in the trial period, it is particularly well-positioned – the $40 ad coupon changes the economics favorably and the primary goal is learning, not profitability optimization.
For sellers past the trial period, the tool’s value depends entirely on the numbers. A store where the empirical CPA is comfortably below the margin per order should scale confidently. A store where CPA exceeds margin needs to diagnose whether the issue is product selection, niche alignment, store quality, or timing – and address the root cause before increasing spend.
The Sellvia ads tool does not create profitable stores by itself. It accelerates the feedback loop between a store’s configuration and real buyer behavior. What the seller does with that feedback – whether they track the right metrics, make adjustments based on data, and invest in the structural factors that drive conversion – is what determines whether the tool becomes an asset or a cost.
The math does not disappear because the setup is simple. But simple setup removes one major barrier to actually running the experiment. And for most beginners, running the experiment is the hardest step.
Frequently Asked Questions About Sellvia Advertising
Does Sellvia Ads guarantee sales? No advertising system guarantees sales – including the built-in Sellvia system. What it guarantees is that traffic will reach your store. Whether visitors convert to buyers depends on your products, price points, store quality, and the match between your catalog and the traffic the system delivers.
How long before the Sellvia ads system starts optimizing? Most digital advertising systems including Sellvia’s need several days to move through initial learning phases. Meaningful performance data typically emerges after 5–7 days of continuous running at a consistent budget. Avoid changing the budget frequently during this period, as changes can reset the optimization process.
Can I pause Sellvia Ads and restart? Yes. Sellers can pause and restart the advertising system from their dashboard. Pausing during periods of low budget or while making store improvements is a reasonable approach.
Is the $40 ad coupon available to all new sellers? The $40 advertising coupon is included with the free 14-day trial. It is designed specifically to allow new sellers to test the advertising system before committing to paid advertising spend.
What happens to advertising performance when I add more products? More products generally improve advertising performance by giving the system more catalog depth to match with diverse buyer intents. Sellers who invest in expanding their product catalog typically see their CPA improve over time as the store becomes more relevant to a broader range of search and browse behaviors.
Should I use the Sellvia ads system exclusively, or combine it with other traffic sources? Relying on a single traffic source for any store creates vulnerability. The most resilient Sellvia stores combine the built-in advertising system with SEO optimization and social media channels to diversify traffic. This also improves the economics – organic traffic has no direct per-visit cost, which raises the effective margin on orders that come through those channels.
When does it make sense to invest in a premium store design? A premium, unique store design improves conversion rate – the percentage of visitors who make a purchase. Since conversion rate directly affects CPA (more conversions per dollar spent on traffic = lower CPA), investing in store quality before scaling ad spend is typically the correct sequence. A premium upgrade should be considered once the store has consistent order flow and the seller is preparing to scale.
This article reflects Sellvia’s current platform and advertising system as of 2025–2026. Platform features, pricing, and advertising mechanics may evolve. Always verify current details at sellvia.com.
12 responses to “Sellvia Built-In Ads Tool Useful Shortcut or Expensive Beginner Trap”
-
I’d push back slightly on the “7 days minimum” rule because honestly, I saw movement way faster than that. I went into this skeptical, thinking there’s no way a built-in ads tool could actually work for someone like me who’s never run a campaign before. Signed up for the trial on Sellvia just to mess around, got the $40 coupon, and set my daily budget to $15 on day one. By day three I had my first order – not a ton, but enough to make me realize the CPA math actually made sense for my product’s margin. The real value for me wasn’t the fancy features, it was how quickly I could go from “I have no idea what I’m doing” to “okay, this is actually generating sales” without needing to become a Google Ads expert. That said, you’re absolutely right that monitoring that CPA to margin ratio is crucial – I definitely learned that lesson when I got impatient and bumped my budget up too fast in week two. But for testing whether a product actually sells? I was profitable within days, not weeks.
-
Yeah, so I tried running ads through their platform during the trial with that $40 coupon and honestly the CPA thing clicked for me way faster than I expected – I hit profitable orders by day 5 just because the single budget dial forced me to actually pay attention instead of guessing on three different ad platforms. The 14 days was legit enough time to see whether my digital products were even worth scaling, which saved me from wasting real money later on something that wasn’t converting.
-
What changed my mind about leaving corporate was realizing I was paying $200+ monthly across different tools I barely used, so when I found Sellvia at $39/month with the built-in ads dashboard already included, it actually made me stop and calculate – that’s legitimately what you’d spend on just the ad management platform alone elsewhere. Your point about the $40 coupon making that break-even math work during the 14-day trial is spot on, because it gave me exactly those 7+ days you mentioned to test if my CPA was actually below my margin before spending real money.
-
Before I found Sellvia’s built-in ads tool, I was manually splitting my budget across three different platforms trying to figure out which one wasn’t hemorrhaging money, but that single budget dial completely eliminated the guesswork since I could finally see my actual CPA against my 60% margin in real time instead of chasing ROAS numbers that made me feel successful while losing money. The $40 coupon they mention paired with that 14-day trial is genuinely the only reason I tested it seriously, and honestly the minimum 7 days of data collection before scaling saved me from blowing through a bigger budget before I understood whether my product-niche fit was even there.
-
[…] a more complete breakdown of how the advertising component works, the Sellvia built-in ads tool breakdown explains why ad spend becomes the main pressure point and how to measure whether it is […]
-
[…] a wide margin. Plan for it as a core line item, not an extra. We took a closer look at how the Sellvia built-in ads tool performs in a separate […]
-
Stumbled on this article while killing time at the airport and the part about the Sellvia Market exit option after 60 days is what actually stopped me scrolling, because as someone who runs numbers for a living, the ability to convert a built store into a lump sum or installment payout changes the entire ROI calculation from a recurring subscription model into something that looks a lot more like an asset acquisition. I tested this thing for about 3 weeks and the exit multiple potential is genuinely the most underrated part of the math here, not the ad coupon or the daily traffic numbers. Going to pull the actual payout data from the Sellvia Market listings tonight and model out a realistic 60-day scenario with the 50-70% margin structure to see what the numbers actually look like on paper.
-
The payment mechanics section is where I actually paused during my lunch break, because the $100 minimum withdrawal threshold is the kind of detail that sounds minor until you run the real numbers on order volume versus commission percentages and realize you need a specific sales cadence just to access your own money consistently. As an accountant I tracked every order processing fee against the 50-70% margin and found that once I hit a rhythm of consistent weekly sales, the $100 threshold stopped feeling like a friction point and started functioning more like a forced savings buffer that kept me from pulling out small amounts too early. The payment system is not flashy but it is mechanically sound – bank transfers cleared without issues once I crossed the threshold, which is more than I can say for other tools I tested where withdrawals were unpredictable. Verdict: worth it, specifically because the payment structure rewards consistency over impulse, which is exactly how a real business should work.
-
Almost cancelled on day 6 because the math looked wrong, well, not exactly wrong but unclear enough that I was one slow afternoon away from walking away. A colleague noticed I’d stopped stress-posting about admin tasks and asked what changed, and honestly the answer was just that I hit my personal breakeven number on day 11 using this thing. The article is right that sales volume and profitability are not the same thing, and that distinction is exactly what I ran through before committing my test budget. The numbers ended up cleaner than I expected compared to what I’d set aside for the experiment.
-
I thought 14 days would be enough time to know – it wasn’t, because the real signal came three Fridays ago when I stopped refreshing the dashboard every hour and just let the system run. The backup supplier mapping section hit differently for me because I lost real money on a previous tool that had zero failover logic and zero accountability when stock vanished. I was the skeptic who warned others away from services like this, so it means something when I say the service I switched to actually changed that math.
-
I thought Sellvia would be another paid traffic disappointment – it wasn’t. After 11 weeks, the built-in ads system is genuinely outperforming the subscription tool I cancelled to fund this, which cost me more and converted less. The article’s point about sales volume versus profitability is the exact math I ran before committing, and with 50-70% commission on digital products, the margin actually holds up when you track it honestly.
-
I thought the ad targeting would be generic and wasted – it wasn’t, and at week 7 the thing that actually surprised me was how fast the system found buyers without me touching a single audience setting.
Related Articles

Leave a Reply